
Draw your first trend line
Draw a trend line, snap it to the candles, change how it looks, and undo or delete it.
- Who it is for
- Traders who want to mark trends and levels on the chart.
- Time
- 4 min
- Steps
- 6 steps
Steps in this guide6 steps
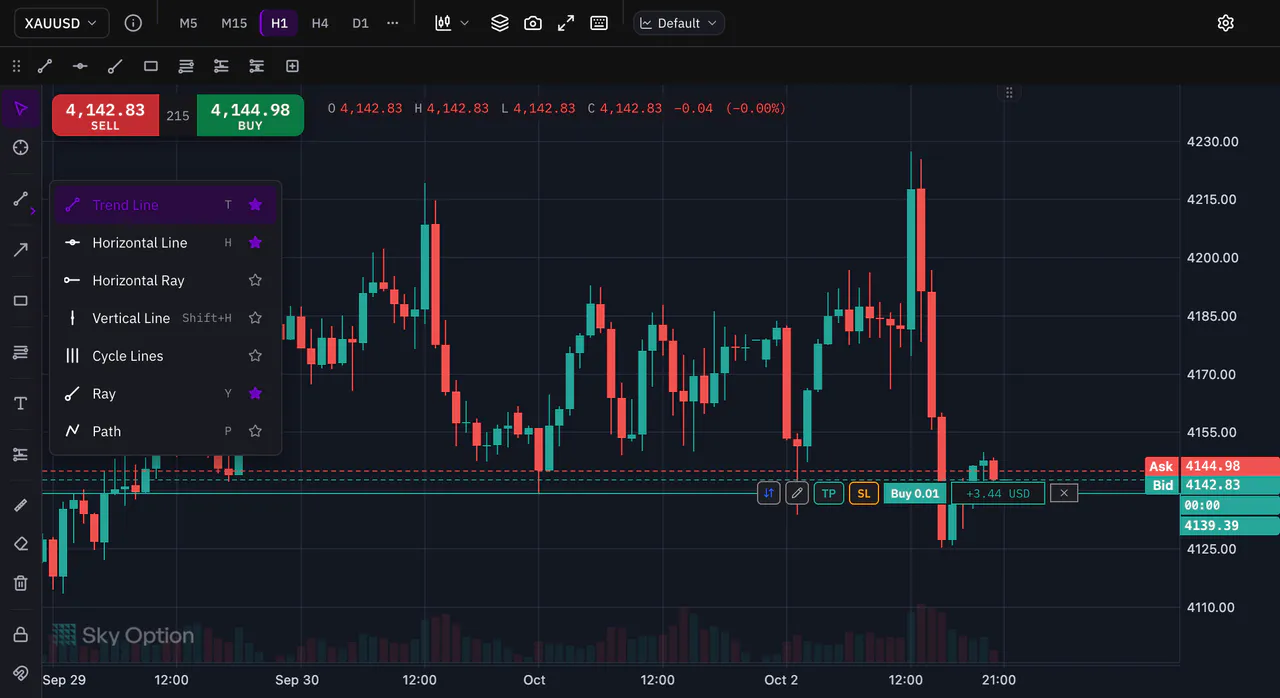
Step 1: Choose Trend Line
In the drawing toolbar beside the chart, find the lines group. Click the small arrow in its corner, or right-click it, and choose Trend Line. Or click the chart and press T.
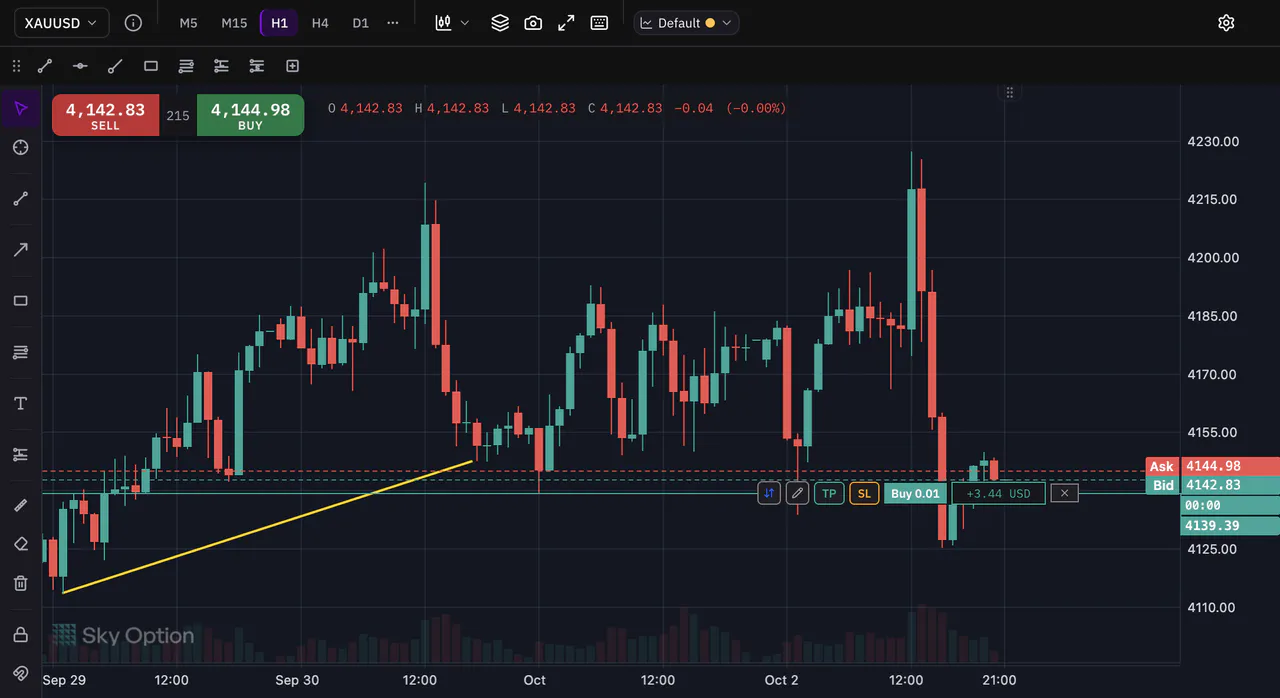
Step 2: Draw the line
Press the mouse button where the line should start, drag to where it should end, and let go. The line is drawn, and the chart goes back to the normal cursor.
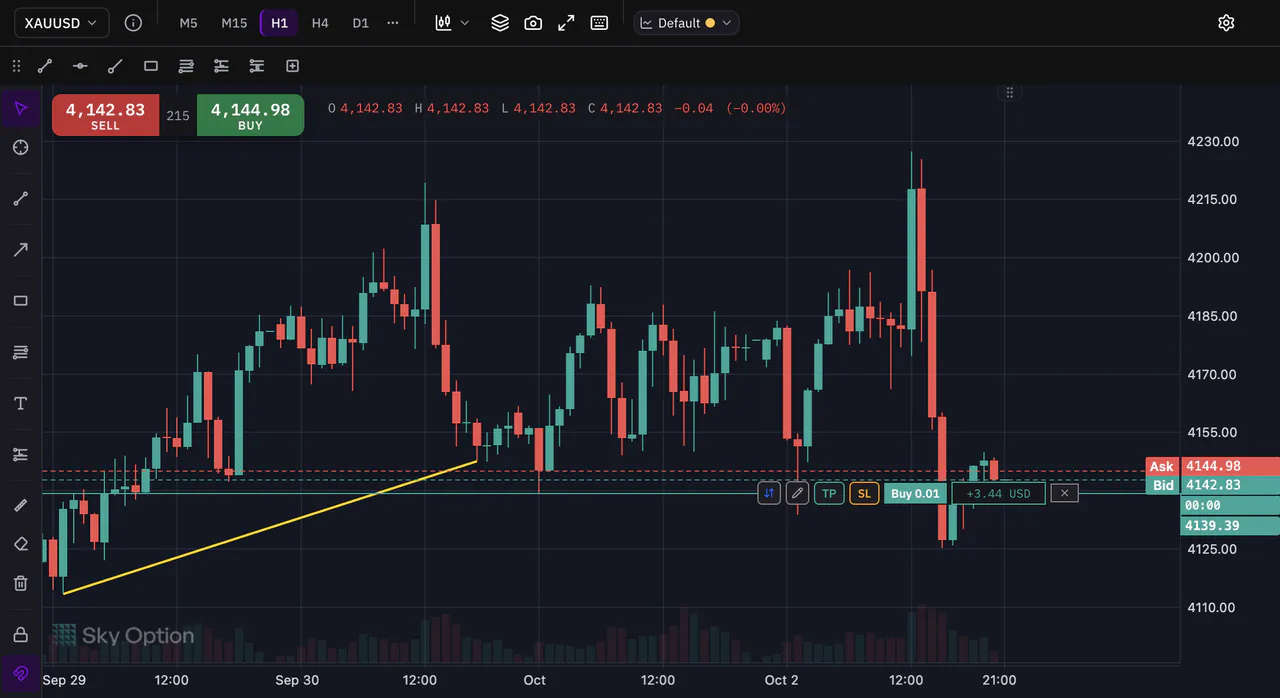
Step 3: Snap to the candles with the magnet
Turn on Magnet snap in the drawing toolbar, or press Shift+M. Each end of your line now sits on the candle under your cursor and, when you are close to it, jumps to that candle’s open, high, low or close, so it lands exactly on the wick you meant.
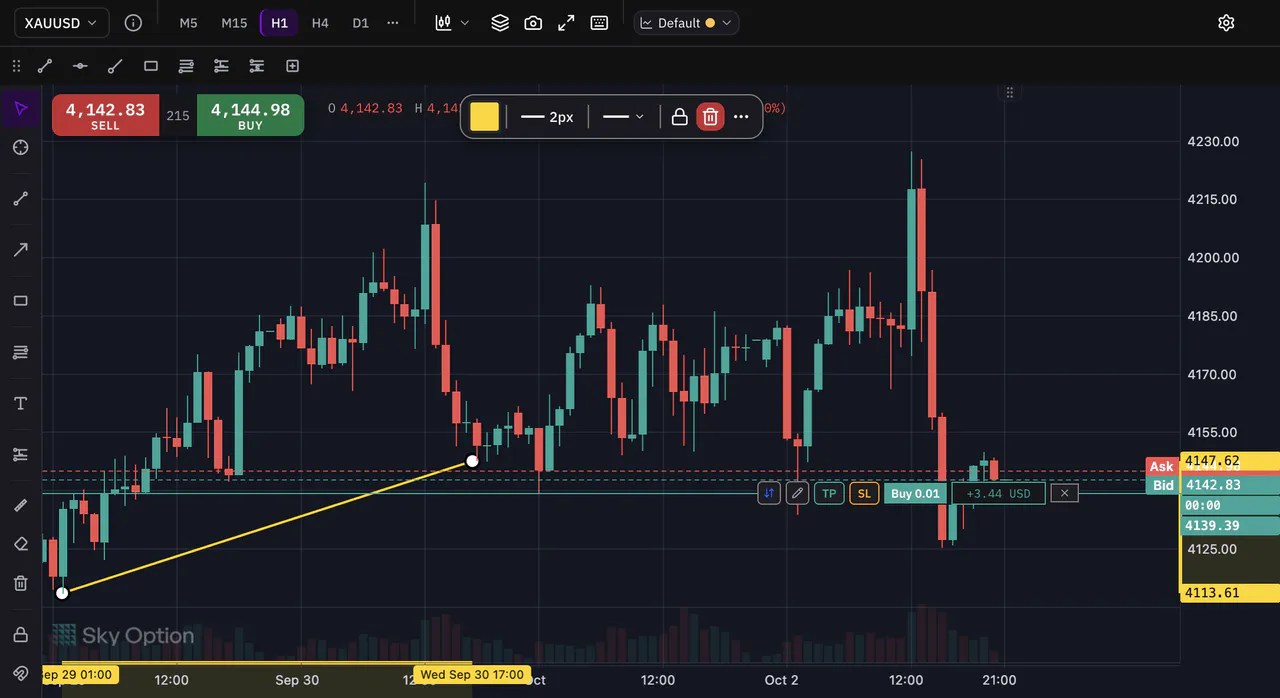
Step 4: Change its colour and width
Click the line to select it. A small bar appears with Color, Width, Line style, Lock and Delete. Pick a new colour and width, and the line changes at once.
Step 5: Undo a mistake
Press Ctrl+Z or CommandZ on a Mac to undo your last change, and Ctrl+Shift+Z or CommandShiftZ on a Mac to bring it back. Sky Trade remembers your last 50 changes, so you can try ideas freely.
Step 6: Delete the line
Select the line and press DeleteorBackspace, or press Delete on its bar. You can also right-click the line and choose Delete.


That is the whole guide
You have done every step. Pick what to learn next, or try it on the live chart.
Up next
- Beginner
Add your first indicators
Open the indicator picker, add RSI and an EMA, change their settings, and hide or remove them.
4 min5 steps - Beginner
Set a price alert
Get told when the price reaches your level, even while you watch another symbol.
3 min5 steps - Pro
Save and reuse chart templates
Save a whole chart setup: colours for both themes, the chart type, indicators and drawings. Put it on any chart, or take it to another computer in a file.
4 min4 steps