
The chart
A full trading chart, in your browser and on your desktop
Draw with the tools chartists use every day, feed one indicator into another, trade from the lines on the chart and watch several markets at once. Everything on this page is in Sky Trade today.

- Drawing tools
- 25
- Indicators
- 31
- Timeframes
- 9
- Multi-chart layouts
- 11
Symbols, chart types and timeframes
Read price your way: candles for detail, a line or an area for the big picture.


Volume on every chart
Volume bars sit under the price on every chart type, so you see activity without adding an indicator.
Candles on the calendar
Weekly candles start on Monday and monthly candles on the first of the month, the way you count them.
Timeframes
- M1
- M5
- M15
- M30
- H1
- H4
- D1
- W1
- MN1
9 timeframes, from one-minute scalps to the monthly trend. Pin the ones you use; the rest wait in a menu.


Reading the chart
Symbol search
Type a few letters to jump to any symbol. Your recent symbols come first, then your watchlist, then every other symbol.
Bid and ask on the chart
Bid and ask lines, each with its own price tag, so you see the real spread and not only the bid.
Candle countdown
A timer under the price tag shows when the current candle closes.
Open, high, low, close
A strip at the top follows your cursor with the open, high, low, close and change of that bar. Alt+O reads it aloud for screen readers.
Drawing tools
The tools chartists reach for every day, from trend lines to Fibonacci and Gann, in one toolbar. Pick a tool to see it on a real chart.
25 shown
Lines


Trend Line
Join two points to follow a trend or mark support and resistance.
Arrows
Shapes
Fibonacci and Gann
Text and labels
Position planning
Measure
Trend Line
Join two points to follow a trend or mark support and resistance.
Lines that land where you meant
With the magnet on, a trend line and a Fibonacci retracement snap to the candles as you draw.


Built around the way you draw
Magnet snap
Points land on the open, high, low or close of a candle. Shift+M turns it on; hold Alt to flip it for one drawing.
Undo and redo
Step back up to 50 times with Ctrl+Z, and forward again with Ctrl+Shift+Z.
Favourites strip
Star the tools you use most and keep them in one strip, docked above the chart or floating where you like.
Precision
Stay in drawing mode
Draw several levels in a row without picking the tool again.
Exact points and labels
The settings dialog changes the style, adds a label to a line, and takes an exact price and time for each point.
Draw on indicators
Draw trend lines inside an indicator pane such as RSI or MACD, not only on price.
Your pointer
The crosshair tool in the drawing toolbar switches the pointer between a cross, a dot and an arrow.
Quick edits
Quick-edit bar
Select a drawing and a small bar offers its colour, width, dash style, lock and delete.
Extend and layer
Extend a line to the left or right, fill a shape, and bring a drawing to the front or send it to the back.
Duplicate
Copy a drawing with Ctrl+D, or hold Ctrl while you drag to leave a copy behind.
Eraser and Clear all
The eraser removes just the drawing you click. Clear all asks first, says how many drawings will go, and can be undone.
Your own defaults
Save a drawing’s style as the default for its tool, and every new one starts that way.
Stay organised
Lock and hide
Lock key levels against stray drags, and hide clutter without deleting it. The chart menu shows hidden drawings again.
Saved per symbol
Drawings are saved with each symbol and pinned to time, so your analysis is where you left it on any timeframe.
Remembers your tool
Each group in the toolbar shows the last tool you picked from it.
Right-click menus
Right-click the chart, a drawing, an indicator pane or a position plan for the actions that belong to it.
Indicators
From moving averages and Bollinger Bands to Ichimoku Cloud, SuperTrend, VWAP and Pivot Points, and you can feed one indicator into another without writing code. Pick one to see it with its default settings.
31 indicators: 14 drawn on the price, 13 oscillators and 4 for volume, each oscillator and volume indicator in its own pane.
31 shown
Overlays


Simple Moving AverageSMA
The average price over a set number of bars. It smooths the noise so the trend is easier to see.
Oscillators
Volume
Simple Moving AverageSMA
The average price over a set number of bars. It smooths the noise so the trend is easier to see.
One indicator on another
Feed one indicator’s output into another: smooth RSI with a moving average, or run RSI on the MACD histogram. No scripting. Moving averages, Bollinger Bands, RSI, MACD and others can also be worked out on the price your method uses.
Price sources
- Close
- Open
- High
- Low
- HL/2 (Median)
- HLC/3 (Typical)
- OHLC/4 (Average)


Every setting, before and after
Set periods, colours and lines before you add an indicator, and change them any time from its legend or its pane. Each value stays within its allowed range, so a typing slip cannot break the chart.


More you can do
Panes the way you read them
Drag a pane’s edge to resize it, or use the arrow keys. Collapse, maximise or move panes up and down, and zoom each one on its own.
Searchable picker
Indicators are grouped by kind and found by name. Alt+I opens the picker.
Several copies
Run the same indicator more than once, such as two moving averages with different periods.
Above or behind the candles
Keep bands behind the candles, add an oscillator to a pane that is already open, and hide a copy without removing it.
Values at your cursor
The legend and the axis show every indicator’s value at the bar under your cursor.
In Arabic too
Indicator settings and descriptions read in Arabic; the names stay the ones traders know.
Room for a full setup
Up to 30 indicators on one chart.
Multi-chart layouts and workspaces
Watch several markets, or one market on several timeframes, side by side.
11 layouts with up to 6 charts. These are their real shapes:
1 chart
Single
2 charts
Side by side Stacked
3 charts
3 columns 1 + 2 2 + 1
4 charts
2 x 2 1 + 3 4 columns
6 charts
2 x 3 3 x 2


Every chart has its own job
Each chart keeps its own symbol, timeframe, type, indicators, drawings and template. A click in the watchlist goes to the chart you are working on, and keyboard shortcuts act only on that chart.
Build your own screen
Around the charts, the rest of the platform is yours to arrange.
Drag and dock
Drop any panel beside, above or into another as a tab, and resize the splits with the mouse or the keyboard.
10 panels
Add what you need from a searchable panel list, and leave out what you do not.
Maximise and tuck away
Give one panel the whole screen and press Esc to come back, or collapse panels to a side rail that opens them on demand.
Undo a closed panel
Closed the wrong panel? Undo brings it back.
6 ready workspaces
Switch between a full trading desk and a clean chart in one menu, save your own, and pick the one that opens at start.
Saved as you work
Your layout is kept between visits, so the screen you built is the screen you come back to.
Chart templates
Save a whole chart setup and put it on any chart from the template menu.
- A template holds the colours for both themes, the chart type, your indicators with their links, the panes and the drawings for each symbol.
- Save with Ctrl+S, or turn on Autosave. A dot tells you when something is not saved yet.
- Rename, delete or reset, and keep up to 50 templates.
- Export a template as a
.skytemplate.jsonfile, with or without drawings, and import it on another computer. Every import is checked first. - Reload the page and each chart comes back with its setup, even the changes you have not saved yet.


Price alerts on the chart
Set an alert where you are looking, and get it even when that chart is closed.
- Right-click a price on the chart to set an alert there, above or below the market.
- Drag the alert’s bell on the price axis to move its level.
- An alert fires once, never at the moment you create it, and follows the bid, the price the chart draws.
- Alerts keep watching when the symbol’s chart is closed: an alert on gold still fires while you trade another market.
- It arrives as a message in the platform and in Events, under the bell, with a chime when Execution sound is on.
- The Price Alerts panel lists every alert, to mute, re-arm or delete with Undo.


Trade from the chart
Your trades live on the chart as lines you can move, and you see the money before you confirm.
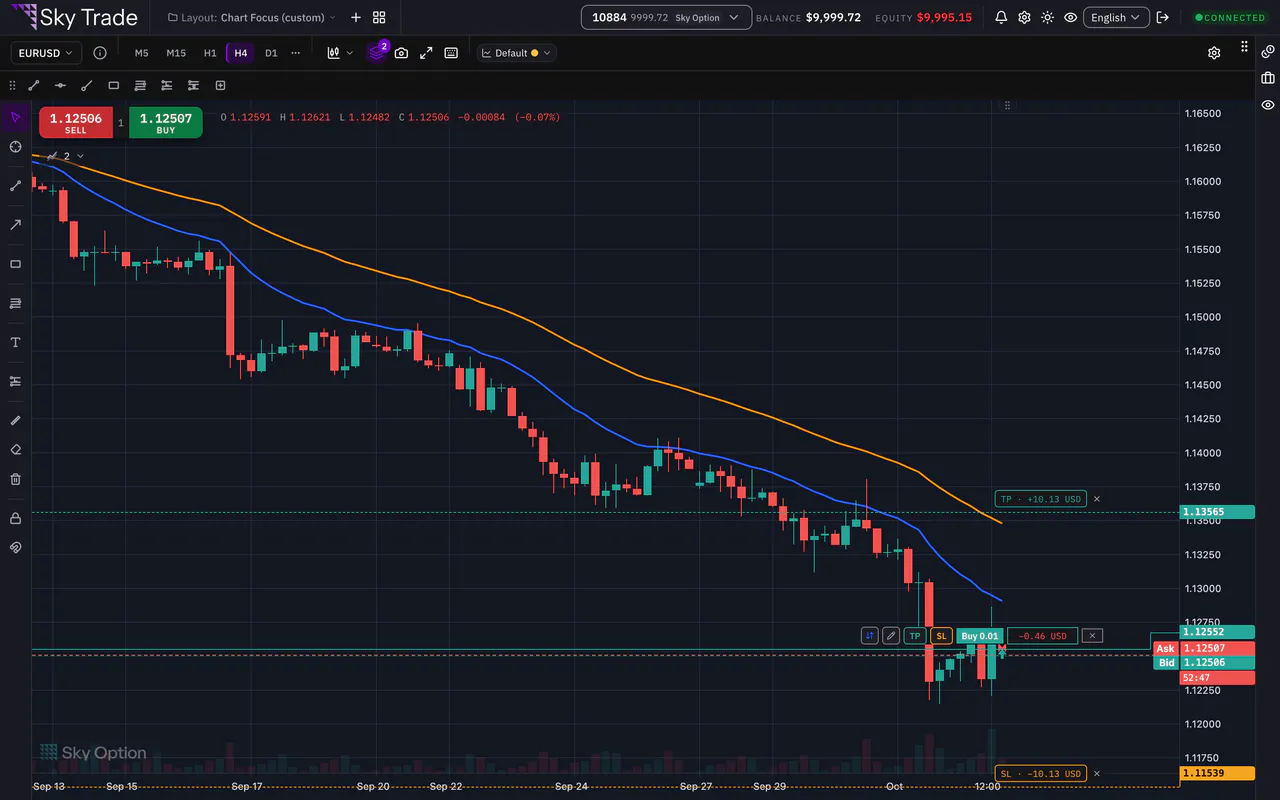
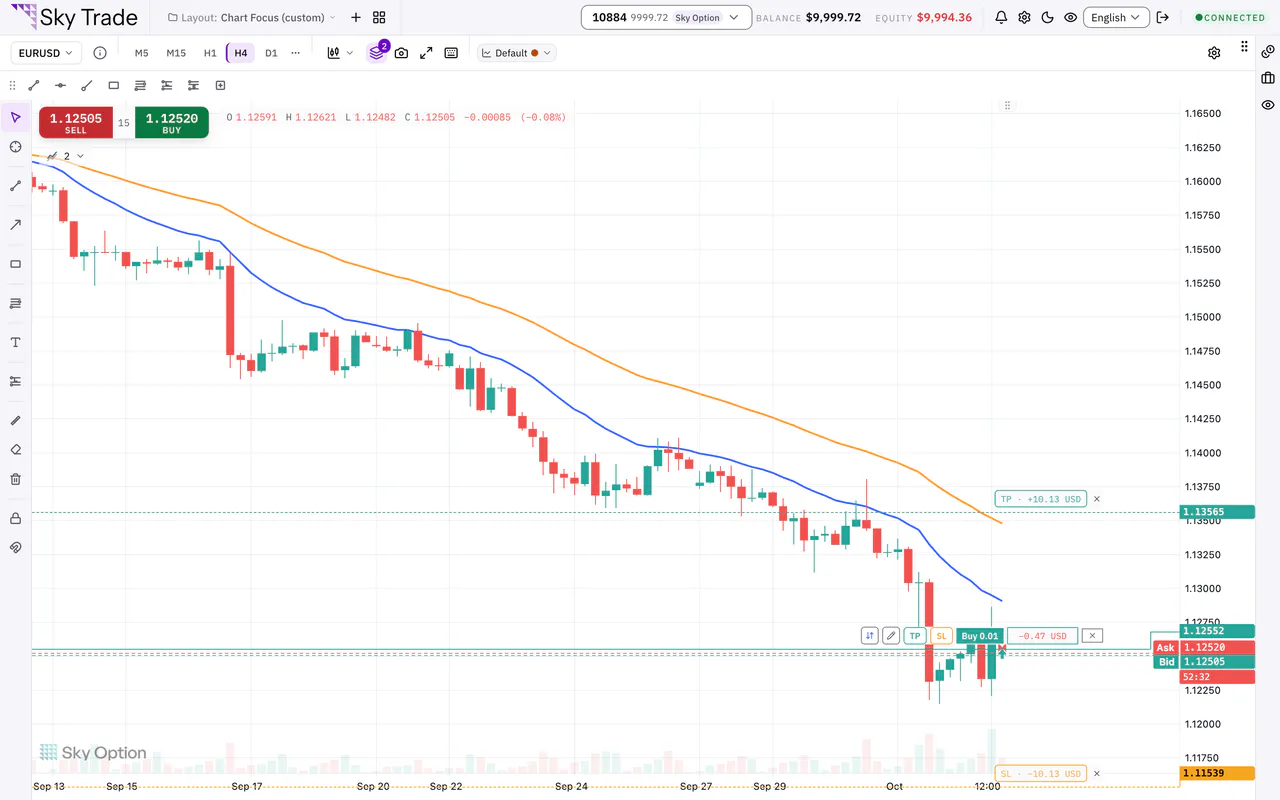
Drag your stop and target, see the result first
Open positions and pending orders sit on the chart with their live profit and loss. Drag a take profit or a stop loss and the line shows the projected result before you confirm; it never goes closer than your broker’s stop level allows. Drag a pending order to a new entry, or close or reverse a position from its line.
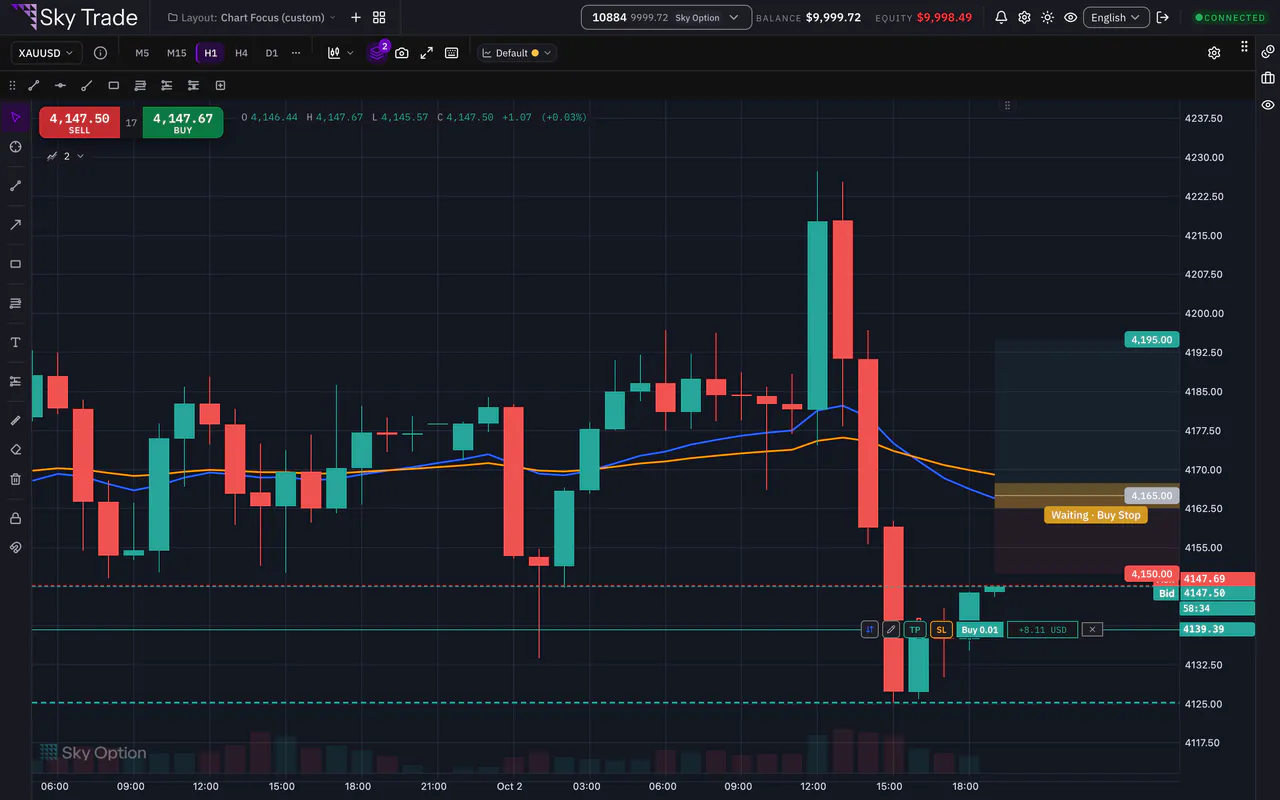
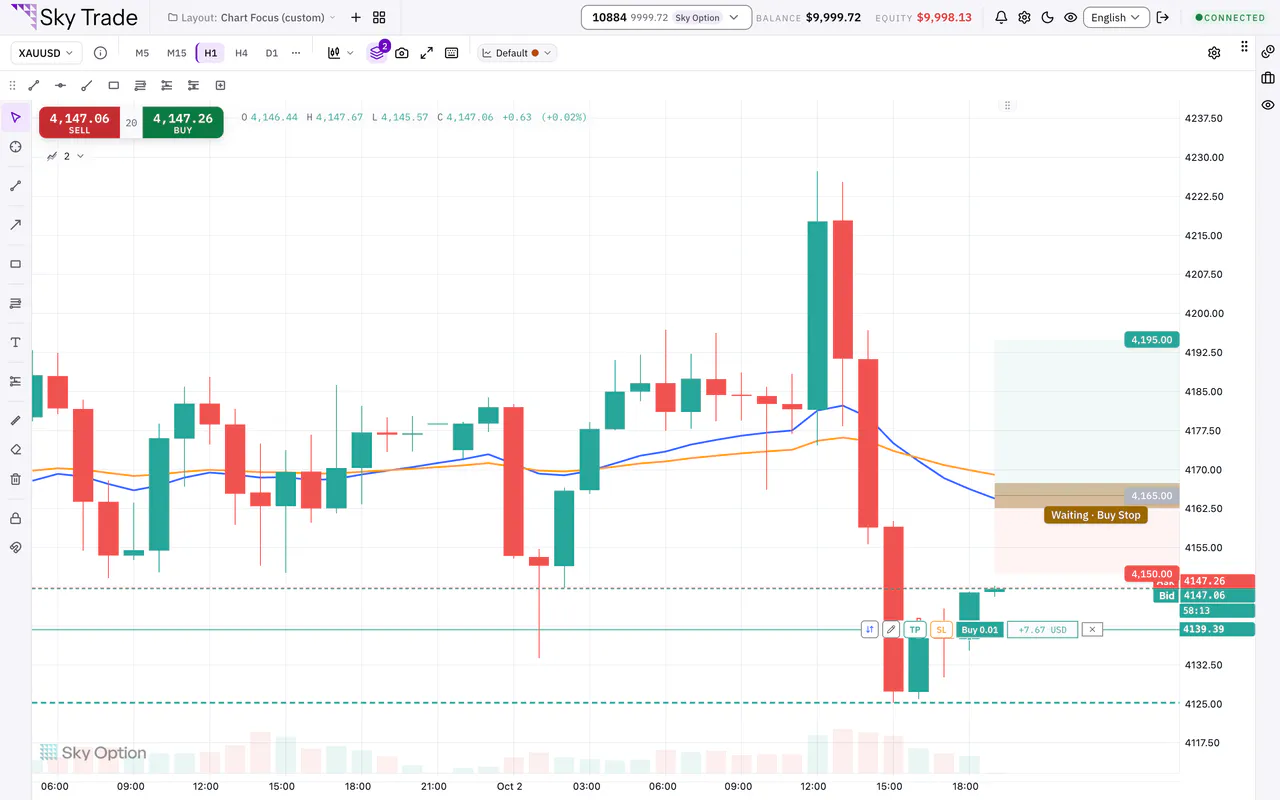
Plan the trade before you place it
Set your risk as a percent of your balance or an amount, and the lot size is worked out from your stop (snapped to the symbol’s lot step), with the margin from your real leverage. Targets and stops in ticks or as a price. The tool also shows whether your account can afford the trade, and lets you flip the side.
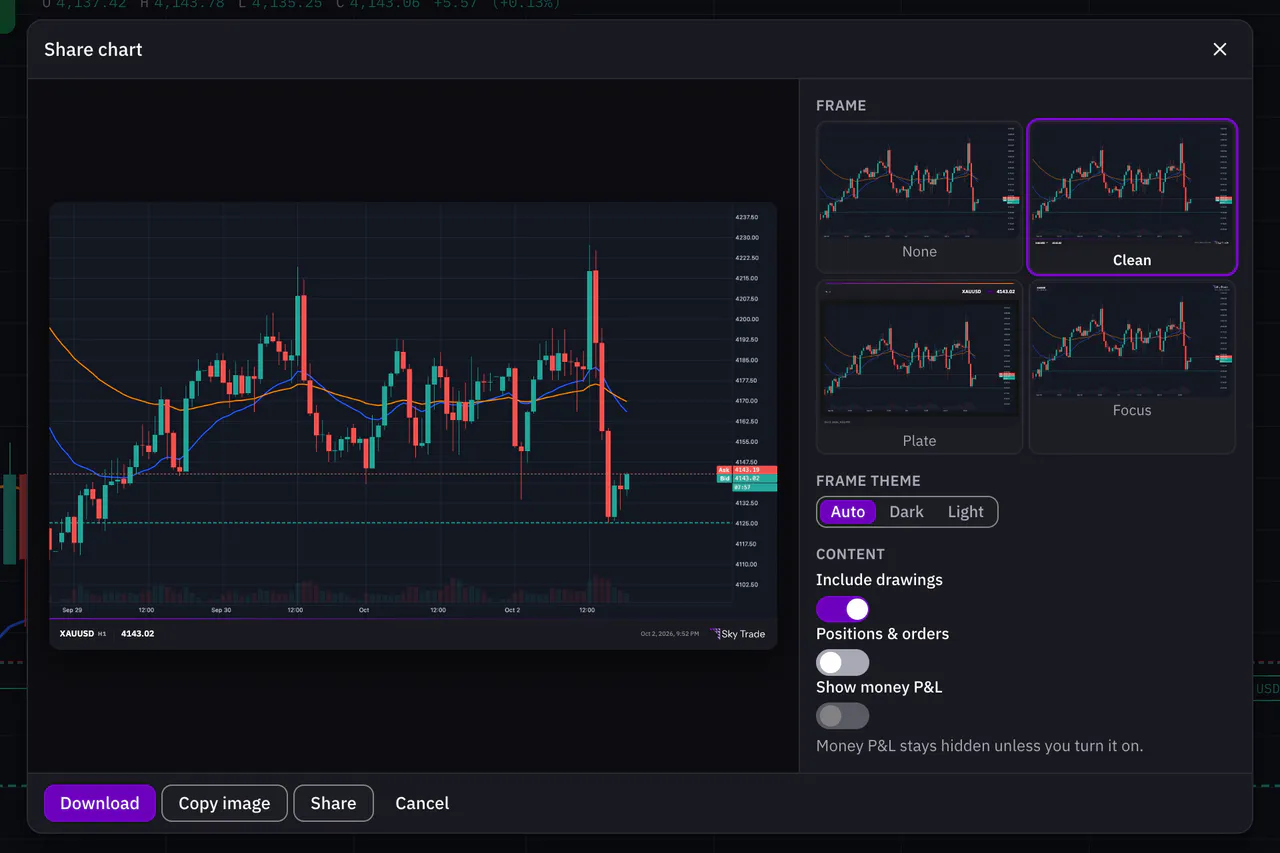
Share a clean chart
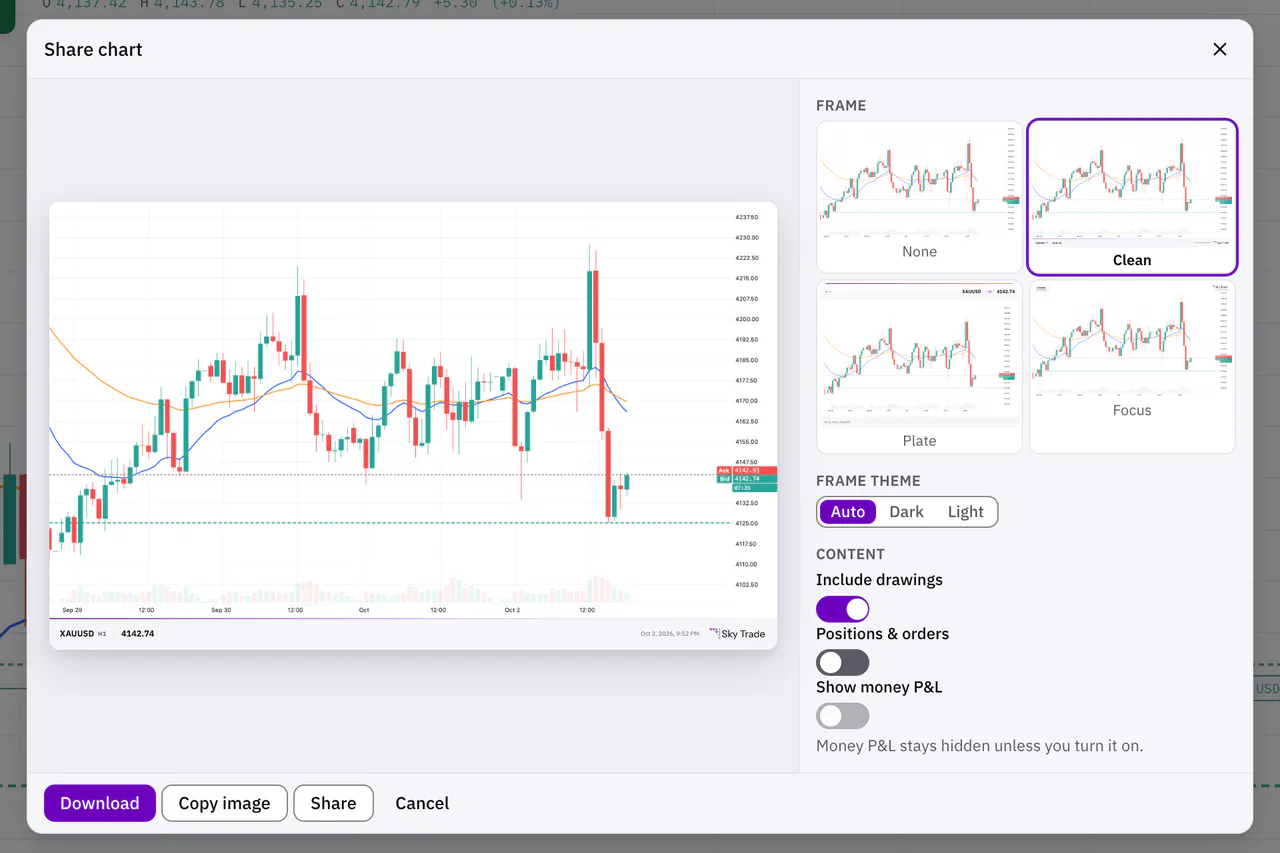
Turn the chart into an image: choose a frame and its theme, include drawings and positions, and keep your money private, because profit in money stays hidden unless you turn it on. Download it, copy it or share it. Share images come with 4 frames to choose from, in a dark or a light theme.


Also on the chart
Buy and Sell on the chart
Buy and Sell buttons with the live bid, ask and spread, so you can trade without leaving the chart.
See the order before you send it
While you fill in the order ticket, its entry, take profit and stop loss appear on the chart as lines you can drag back into the form.
Where you got in and out
Entry and exit arrows on the candles, joined by a line that shows a win or a loss, with the details on hover.
The chart goes further
Chart settings
Change colours, grid and crosshair and watch the chart change as you go; Cancel puts them back.
- Sections for appearance, trade colours, scale, grid, crosshair, time scale and trading, with a search that finds any setting. A reset button in each look section brings the chart’s whole look back to its defaults.
- The price scale on the right, on the left or hidden, and time shown with or without AM and PM.
- Period separators mark where each day, week or month begins.
- Drag the space after the last candle to leave room for your projections.
- Decide how your trades look: positions and orders on or off, line style, width and opacity, profit in money, ticks or percent, and nearby positions merged.
- Chart time is shown in UTC, the time the server stamps its candles with, and the live candle follows the server’s clock, not your computer’s.
30 keyboard shortcuts
Pick drawing tools, edit drawings, reset the view and open the indicator picker without the mouse. Press ? on the chart for the list.


Built to stay smooth
A chart engine made for drawing and live prices, not a picture of a chart.
Drawn with PixiJS on WebGL
The chart is drawn by your graphics hardware and redraws only when something changes.
Only what changed
A price tick repaints only what it touches, and labels are reused, so they never flicker.
Indicators keep up
On each tick, indicators update their newest values instead of working out their whole history again.
Quick to pick
An index of where each drawing sits finds the one under your cursor, so a busy chart stays easy to edit.
Hidden charts rest
A chart you cannot see stops drawing, so a multi-chart screen does not waste your laptop’s power.
Sharp at any size
Crisp on high-density screens, even after a move to another monitor or a browser zoom, and chart labels follow the text size you chose.
Moves with your hand
Wheel zoom centres on your cursor, drags carry on with momentum, either axis zooms when you drag it, and a double-click on the price axis fits the price again. Alt+R resets the view.
History on demand
Scroll left to load older candles. Candles you have loaded are kept in your browser, so a chart you come back to can open from there.
Loads what you use
Trading Lab loads the first time you use it, and the AI loads separately after the chart, so the first screen carries only the chart and your trading.
Put the chart to work
Try the live chart on this site, or open a free demo account with virtual money to use every tool on this page.