
Chart basics
Change the symbol, the timeframe and the chart type, move around the chart, and read any candle.
- Who it is for
- Anyone opening the Sky Trade chart for the first time.
- Time
- 4 min
- Steps
- 5 steps
Steps in this guide5 steps
Step 1: Change the symbol
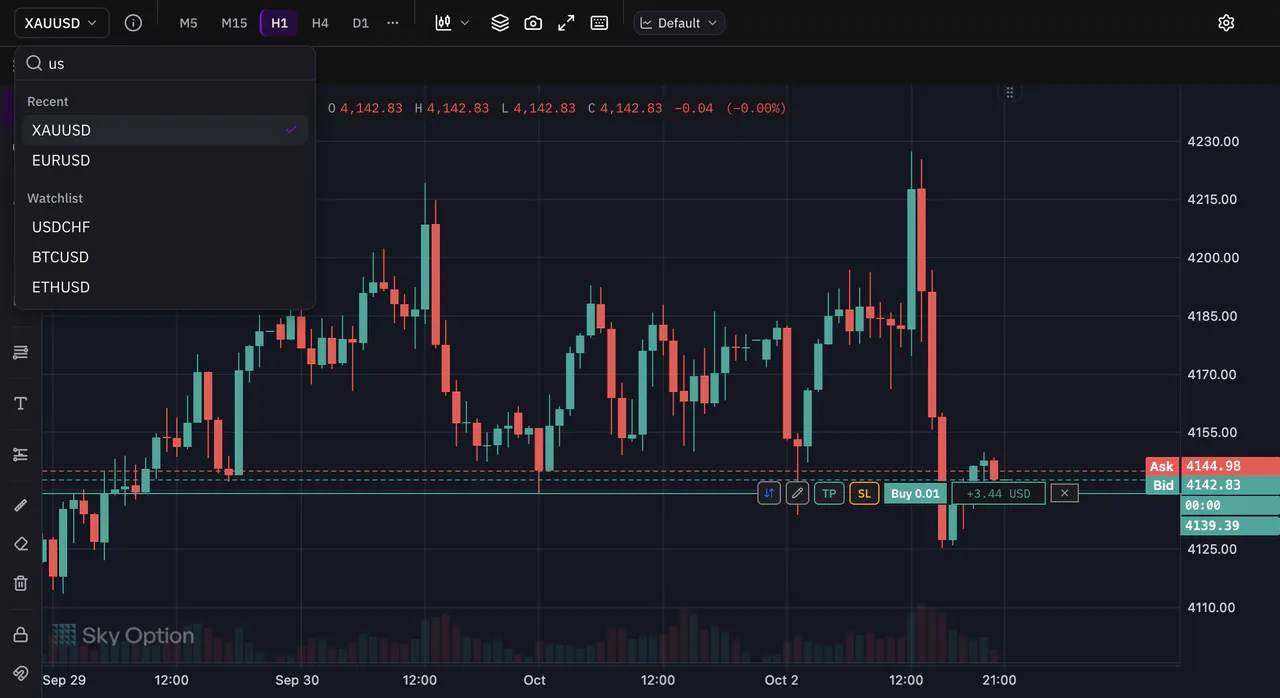
Click the symbol name at the top of the chart and type a few letters in the Search symbols… box. Your Recent symbols come first, then your Watchlist, then All symbols. Click one to open it.
Step 2: Pick a timeframe
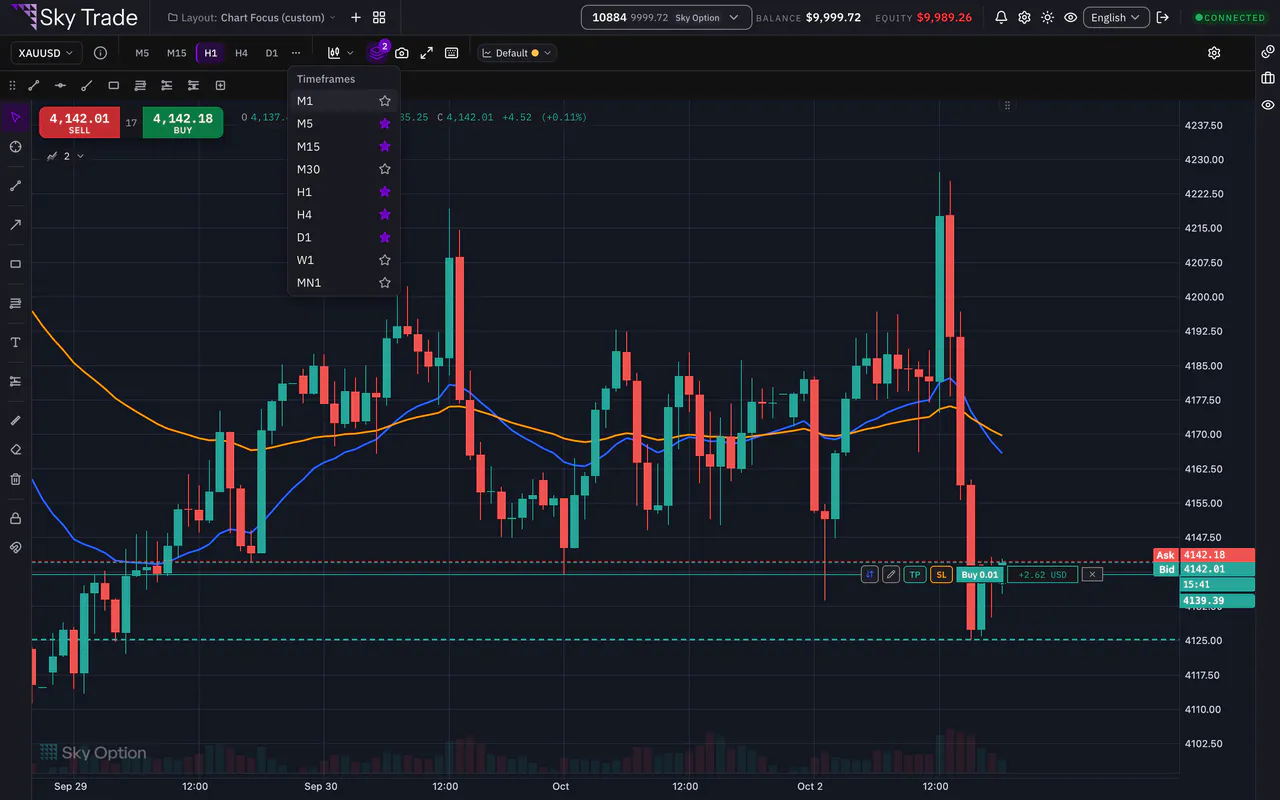
Click one of the timeframe buttons above the chart. Sky Trade has 9 timeframes, from one minute to one month.
Step 3: Switch the chart type
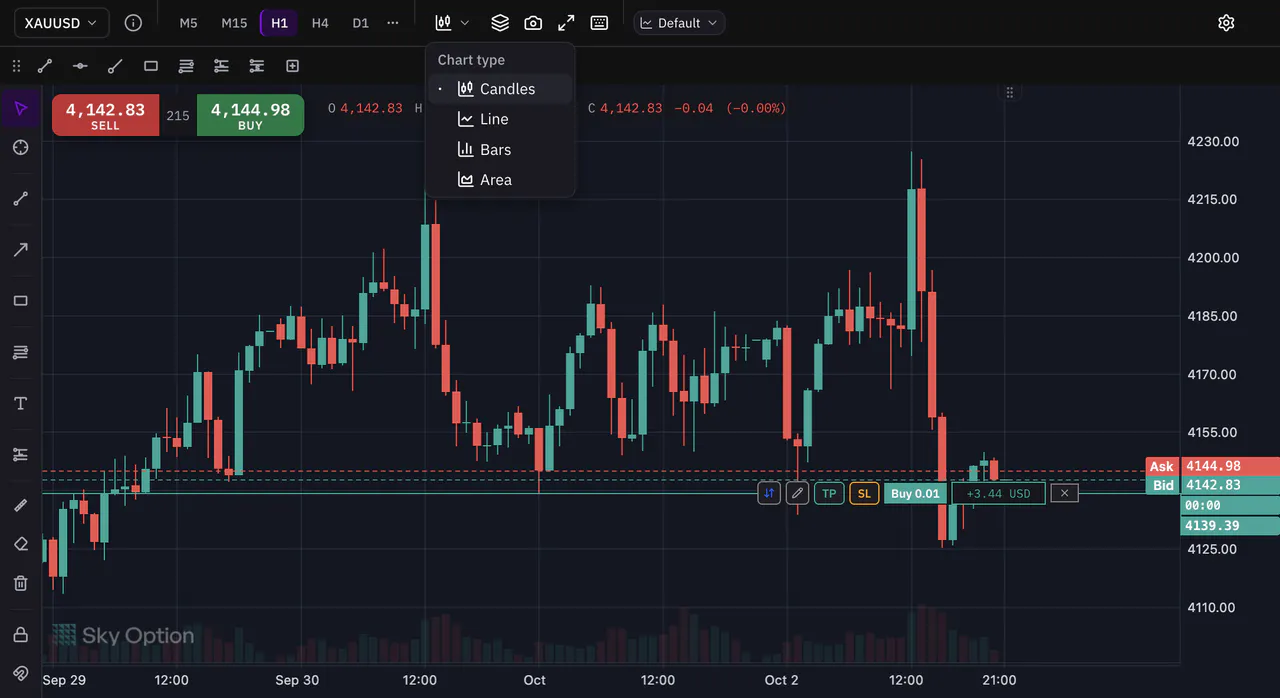
Open the Chart type menu next to the timeframes and pick one of the 4 types: Candles, Line, Bars or Area.
Step 4: Zoom, move and reset the view
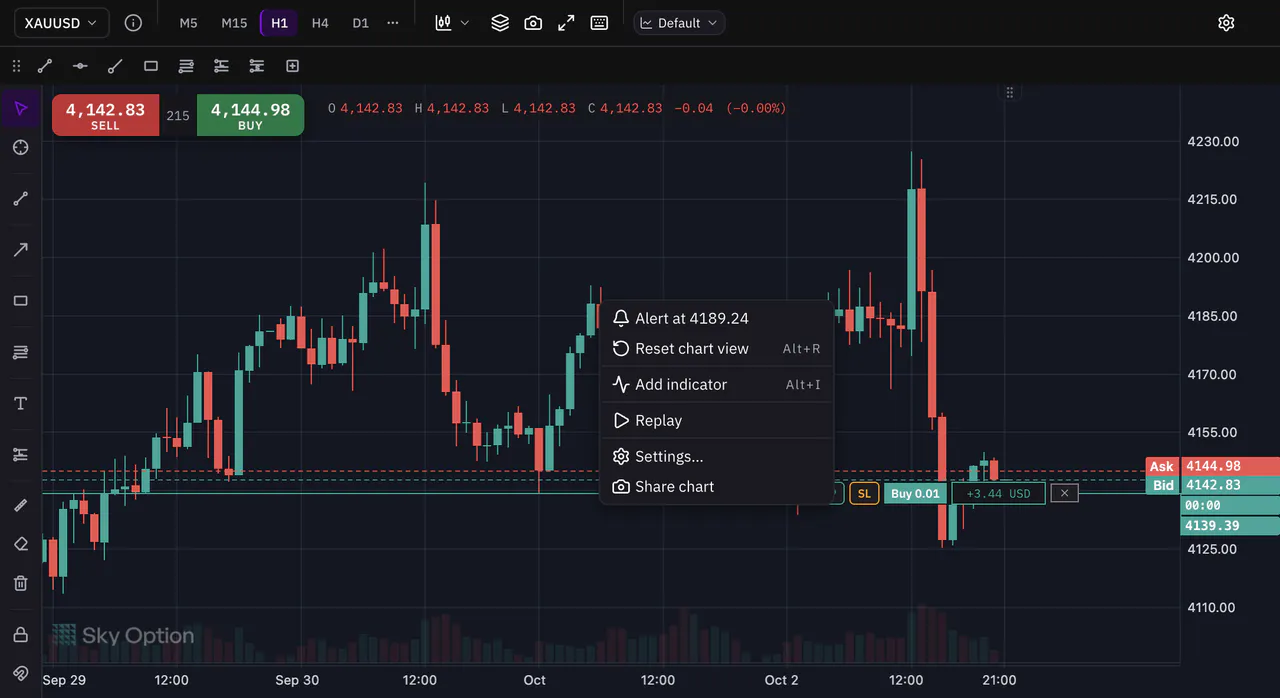
Scroll the mouse wheel to zoom in or out where your cursor is. Drag the chart to go back in time. Drag the price scale or the time scale to stretch it. To get the normal view back, press Alt+R or OptionR on a Mac, or right-click the chart and choose Reset chart view.
Step 5: Read a candle
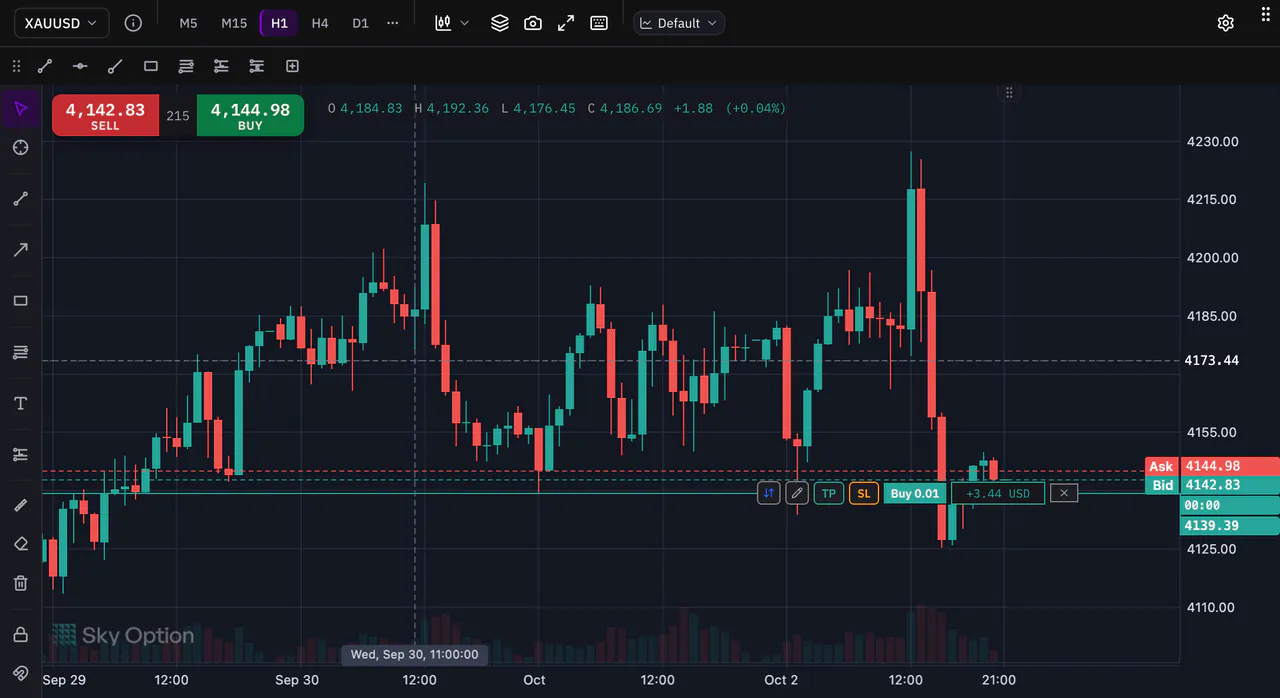
Move your cursor over any candle. The line of figures at the top of the chart shows its open, high, low and close, and how much it changed. Move the cursor away and it shows the newest candle again.


That is the whole guide
You have done every step. Pick what to learn next, or try it on the live chart.
Up next
- Beginner
Draw your first trend line
Draw a trend line, snap it to the candles, change how it looks, and undo or delete it.
4 min6 steps - Beginner
Add your first indicators
Open the indicator picker, add RSI and an EMA, change their settings, and hide or remove them.
4 min5 steps - Pro
Keyboard shortcuts for the chart
Pick drawing tools, undo, open the indicators and save your template without reaching for the mouse. The chart answers to 30 shortcuts.
3 min4 steps