
Add your first indicators
Open the indicator picker, add RSI and an EMA, change their settings, and hide or remove them.
- Who it is for
- Traders who want to add indicators to their chart.
- Time
- 4 min
- Steps
- 5 steps
Steps in this guide5 steps
Step 1: Open the indicator picker
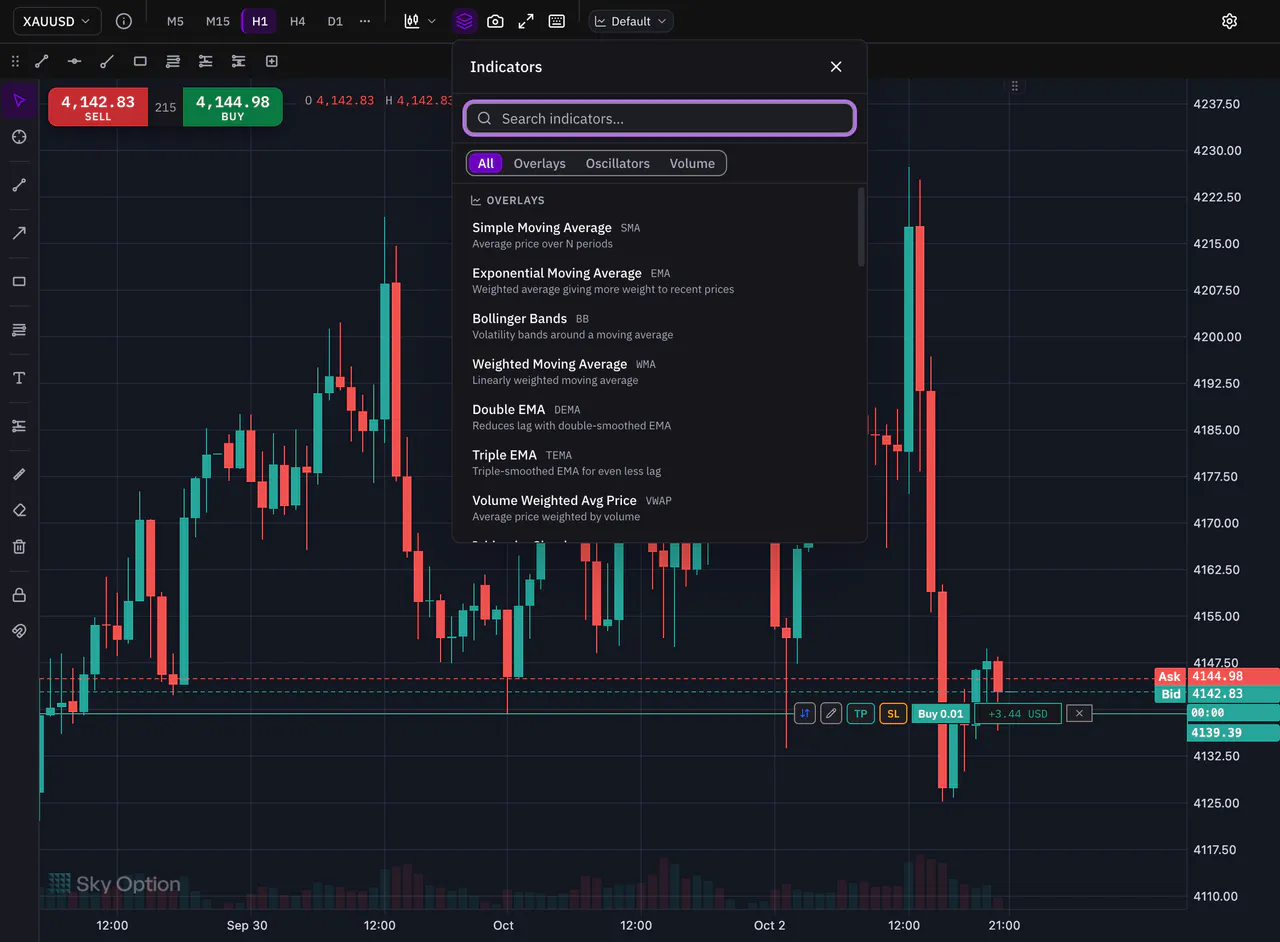
Click Indicators above the chart, or press Alt+I or OptionI on a Mac. The picker holds all 31 indicators in three groups: Overlays, Oscillators and Volume.
Step 2: Search for RSI and add it
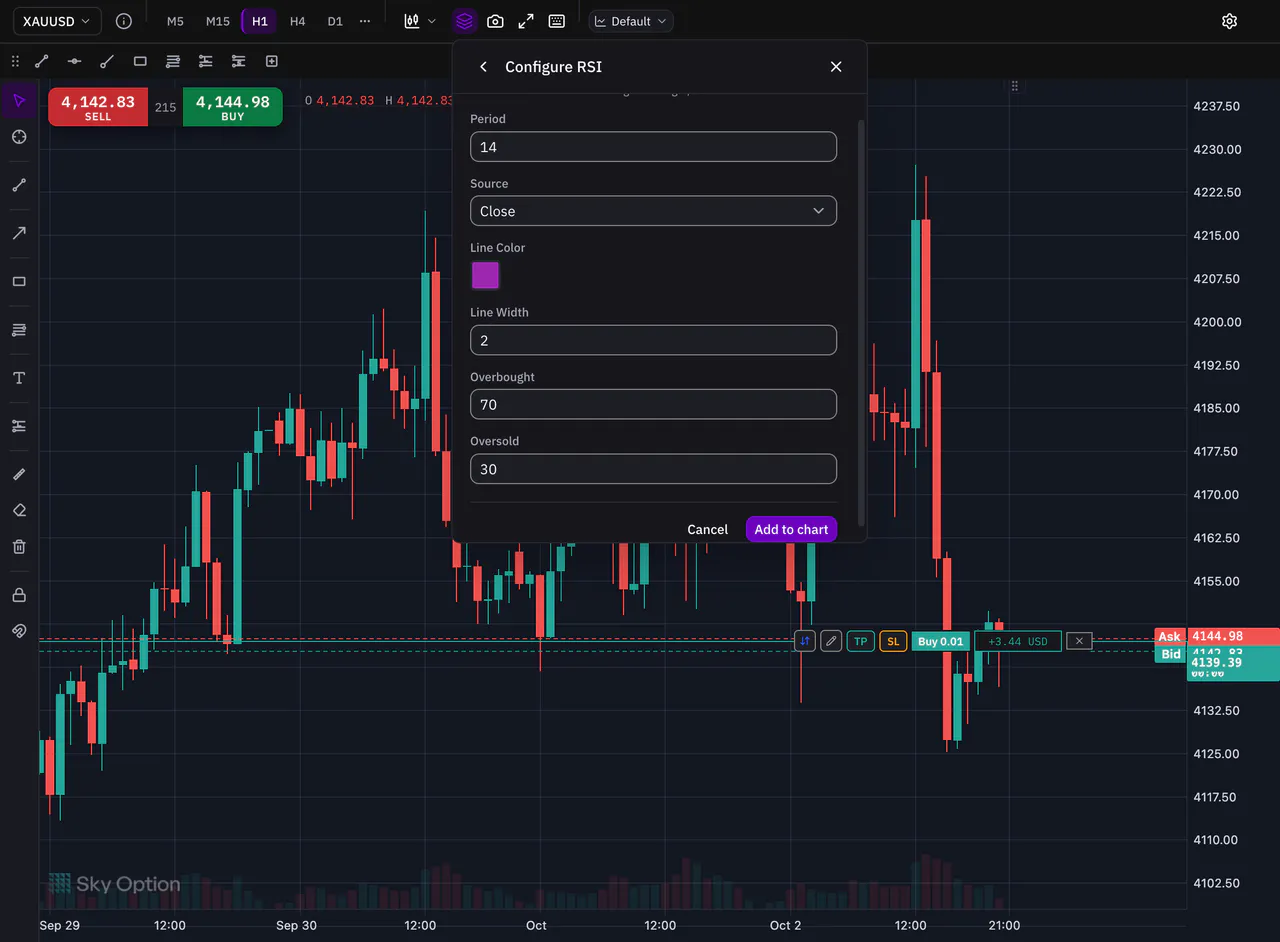
Type RSI in Search indicators… and click Relative Strength Index. Its settings open first: keep them as they are and press Add to chart. RSI opens in its own pane under the price.
Step 3: Change its period
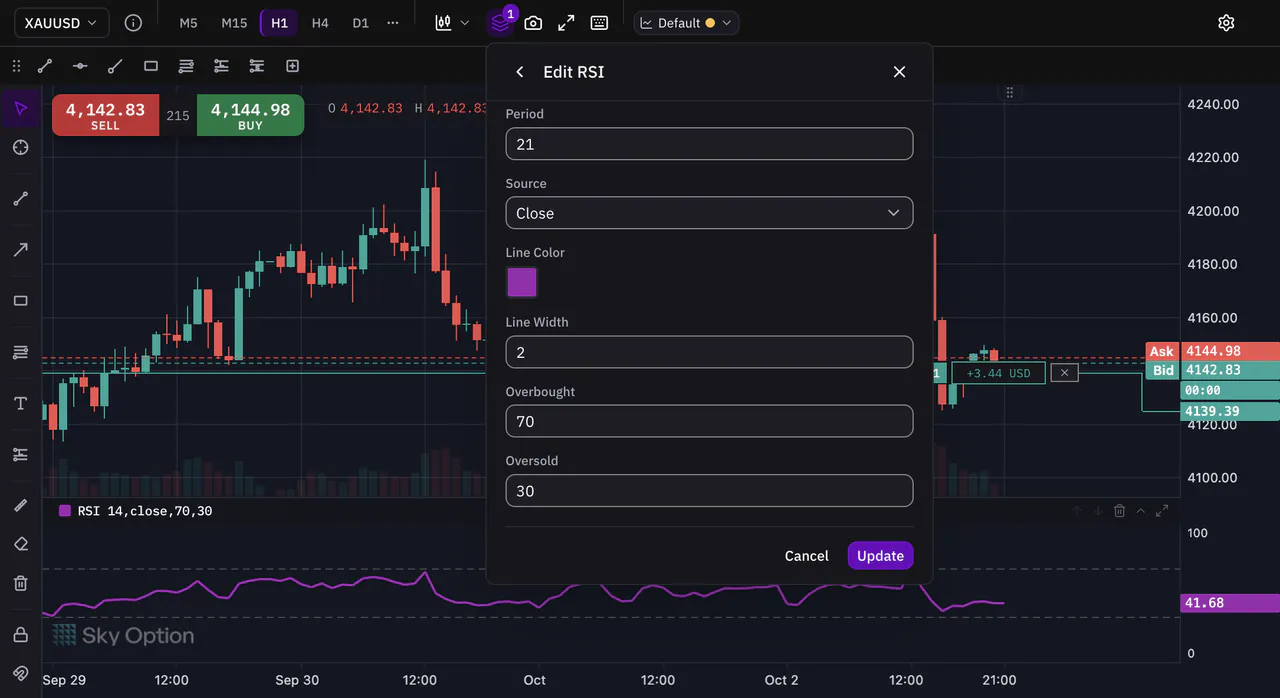
Point at the RSI pane and click Edit indicator in its header. Change Period, then press Update. The line redraws with the new setting.
Step 4: Add an EMA on the price
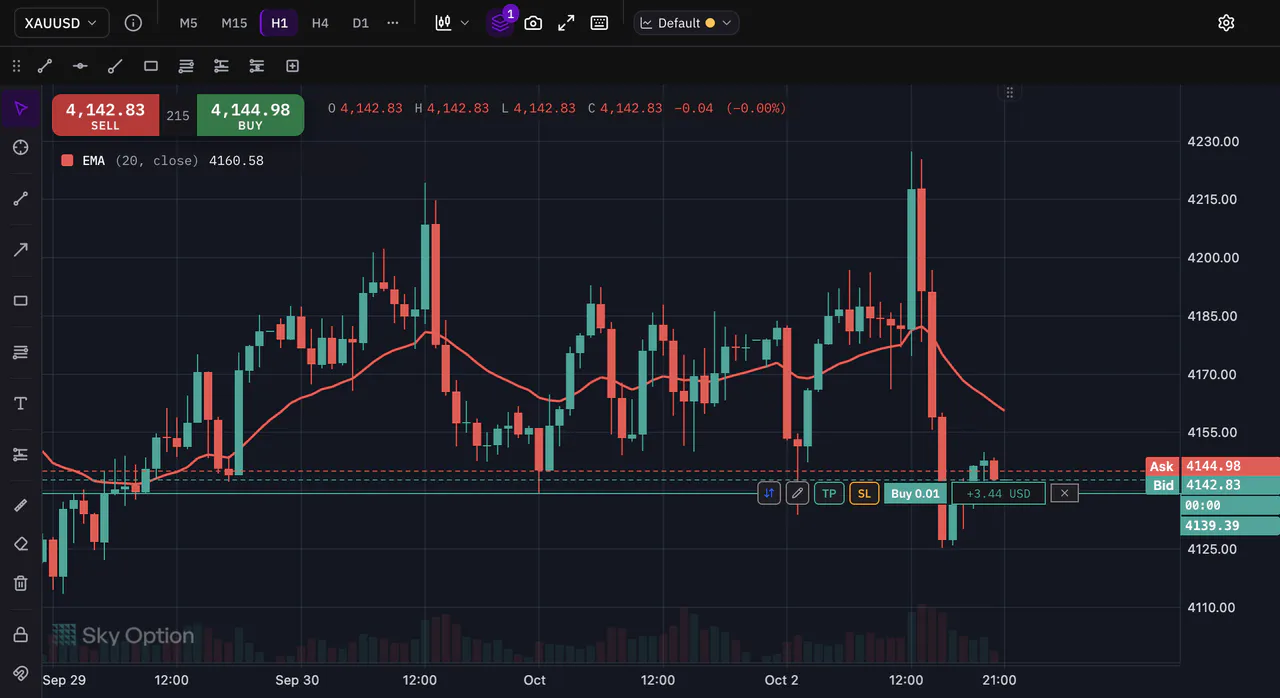
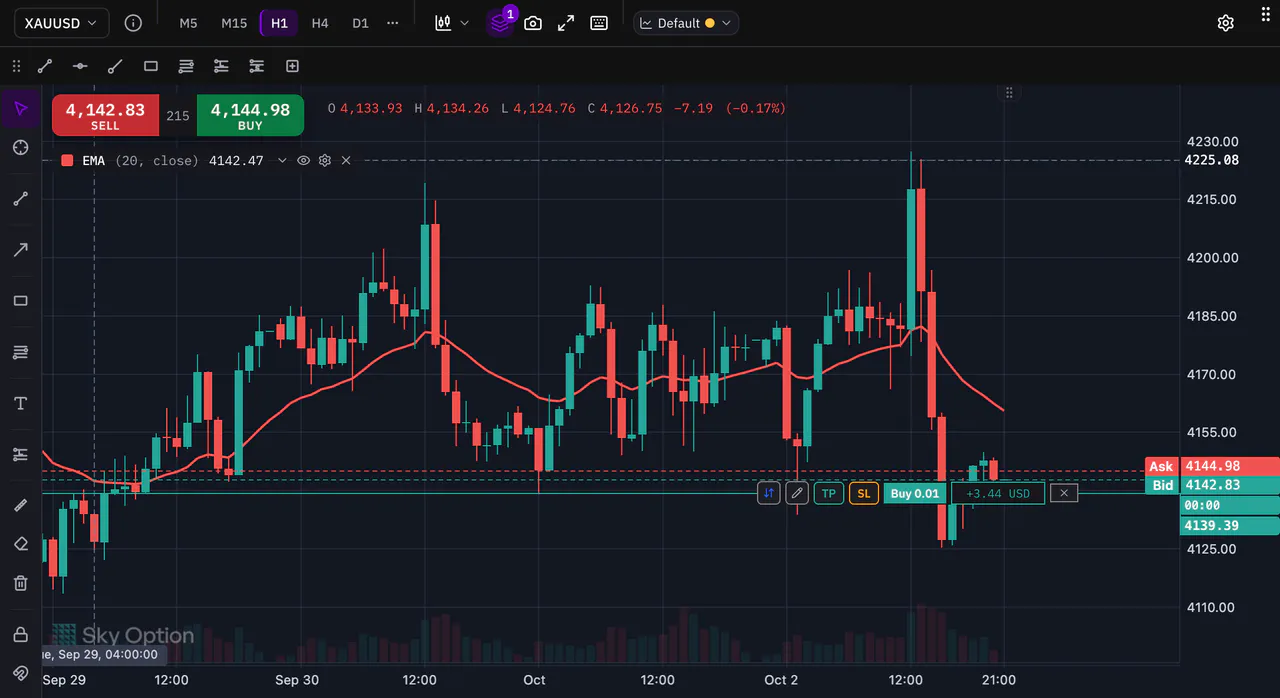
Open the picker again, search for EMA and click Exponential Moving Average. Set its Period and press Add to chart. It is drawn over the candles.
Step 5: Hide or remove an indicator
Point at the indicator’s name on the chart to see its buttons. Hide indicator takes it off the chart for now and keeps its settings. Remove indicator deletes it.


That is the whole guide
You have done every step. Pick what to learn next, or try it on the live chart.
Up next
- Pro
Feed one indicator into another
Smooth RSI with a moving average, or run RSI on the MACD histogram: pick another indicator’s line as the Source. 11 indicators have one, with no scripting.
4 min4 steps - Beginner
Build your watchlists
Add the symbols you follow, keep a list for each market or idea, and switch between your lists.
3 min4 steps - Beginner
Place your first trade on your demo account
Open a market order from the chart with a take-profit and a stop-loss, follow it on the chart, change it and close it, all on your demo account.
6 min7 steps